Electric Charging Stations: Data Analysis (Pt. 1)
Hi everyone, I know it has been quite some time since I last posted, so I decided to share some quick analyses I have been tracking in relation to the number of electric charging stations within the United States. The buildout of EV infrastructure is imperative to the adoption of EVs. Thus, I am curious to see how the count and density of the charging stations are developing today.
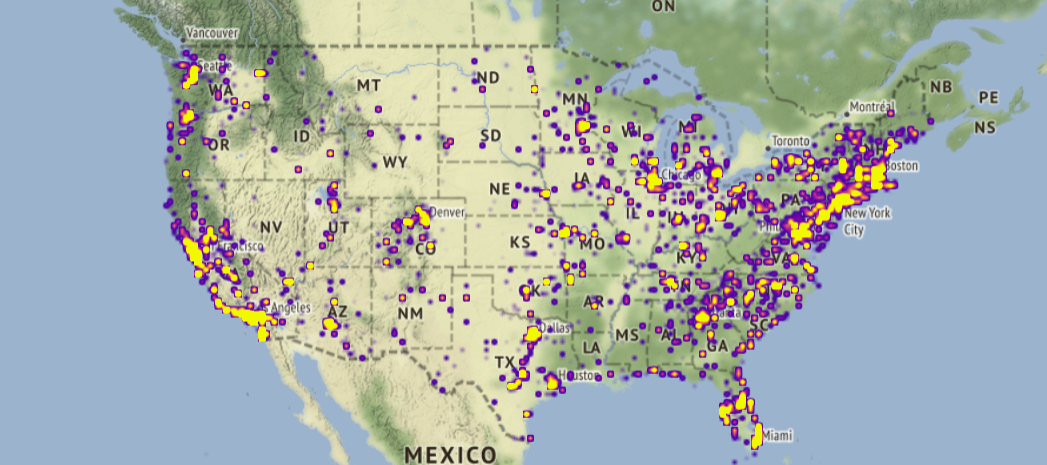
Pulling the data from the National Renewable Energy Laboratory via its API, I was able to filter for electric charging stations that are available to the public and plot the density of the locations for the U.S. Of the approximately 50,000 stations within the U.S., we can see most of the infrastructure is built along relatively dense urban centers. The top 3 states with the most number of electric charging stations include 1) California (14,543), 2) New York (3,111), and 3) Florida (2,631). The state with the fewest available chargers is Alaska at a humble number of 53 locations.
To get a sense of density for the existing road infrastructure, I calculated the number of charging stations per road mile available. Pulling the road mile data from the Federal Highway Administration, I was able visualize the density by state:
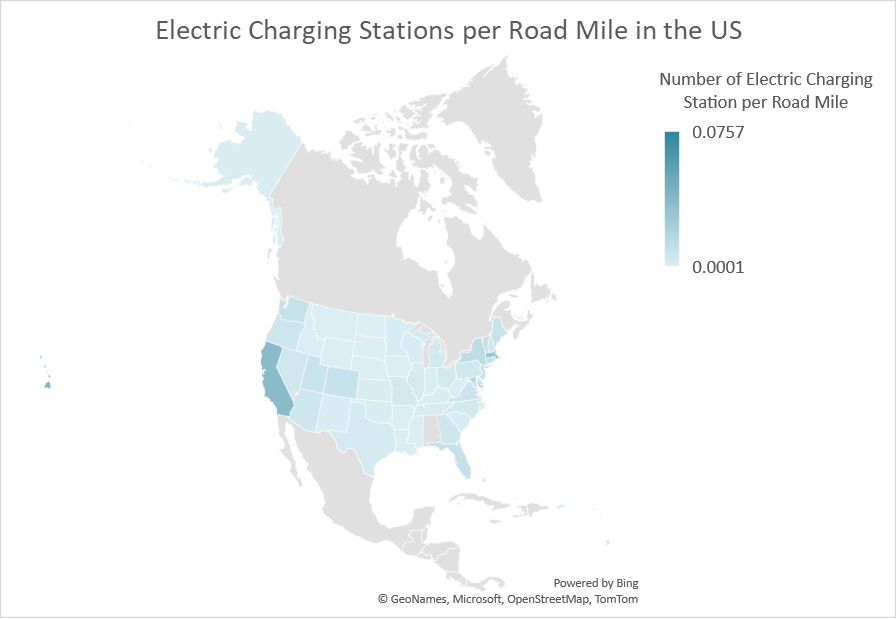
Interestingly, the top 3 most dense areas include 1) Washington D.C., 2) Hawaii, and 3) California. The least dense state is South Dakota.
Below are the links to the source data:
- Alternative Fuel Stations Data provided by the NREL
- Road Mile Data from the Federal Highway Administration