Holiday Shopping
During this Thanksgiving and my subsequent shopping spree in preparation for the holidays, I was curious to see how the consumer spend is faring given the negative sentiment surrounding inflation, tech layoffs and tech stock compression in recent months.
First, I wanted to take a look at the trade balance for the U.S.:
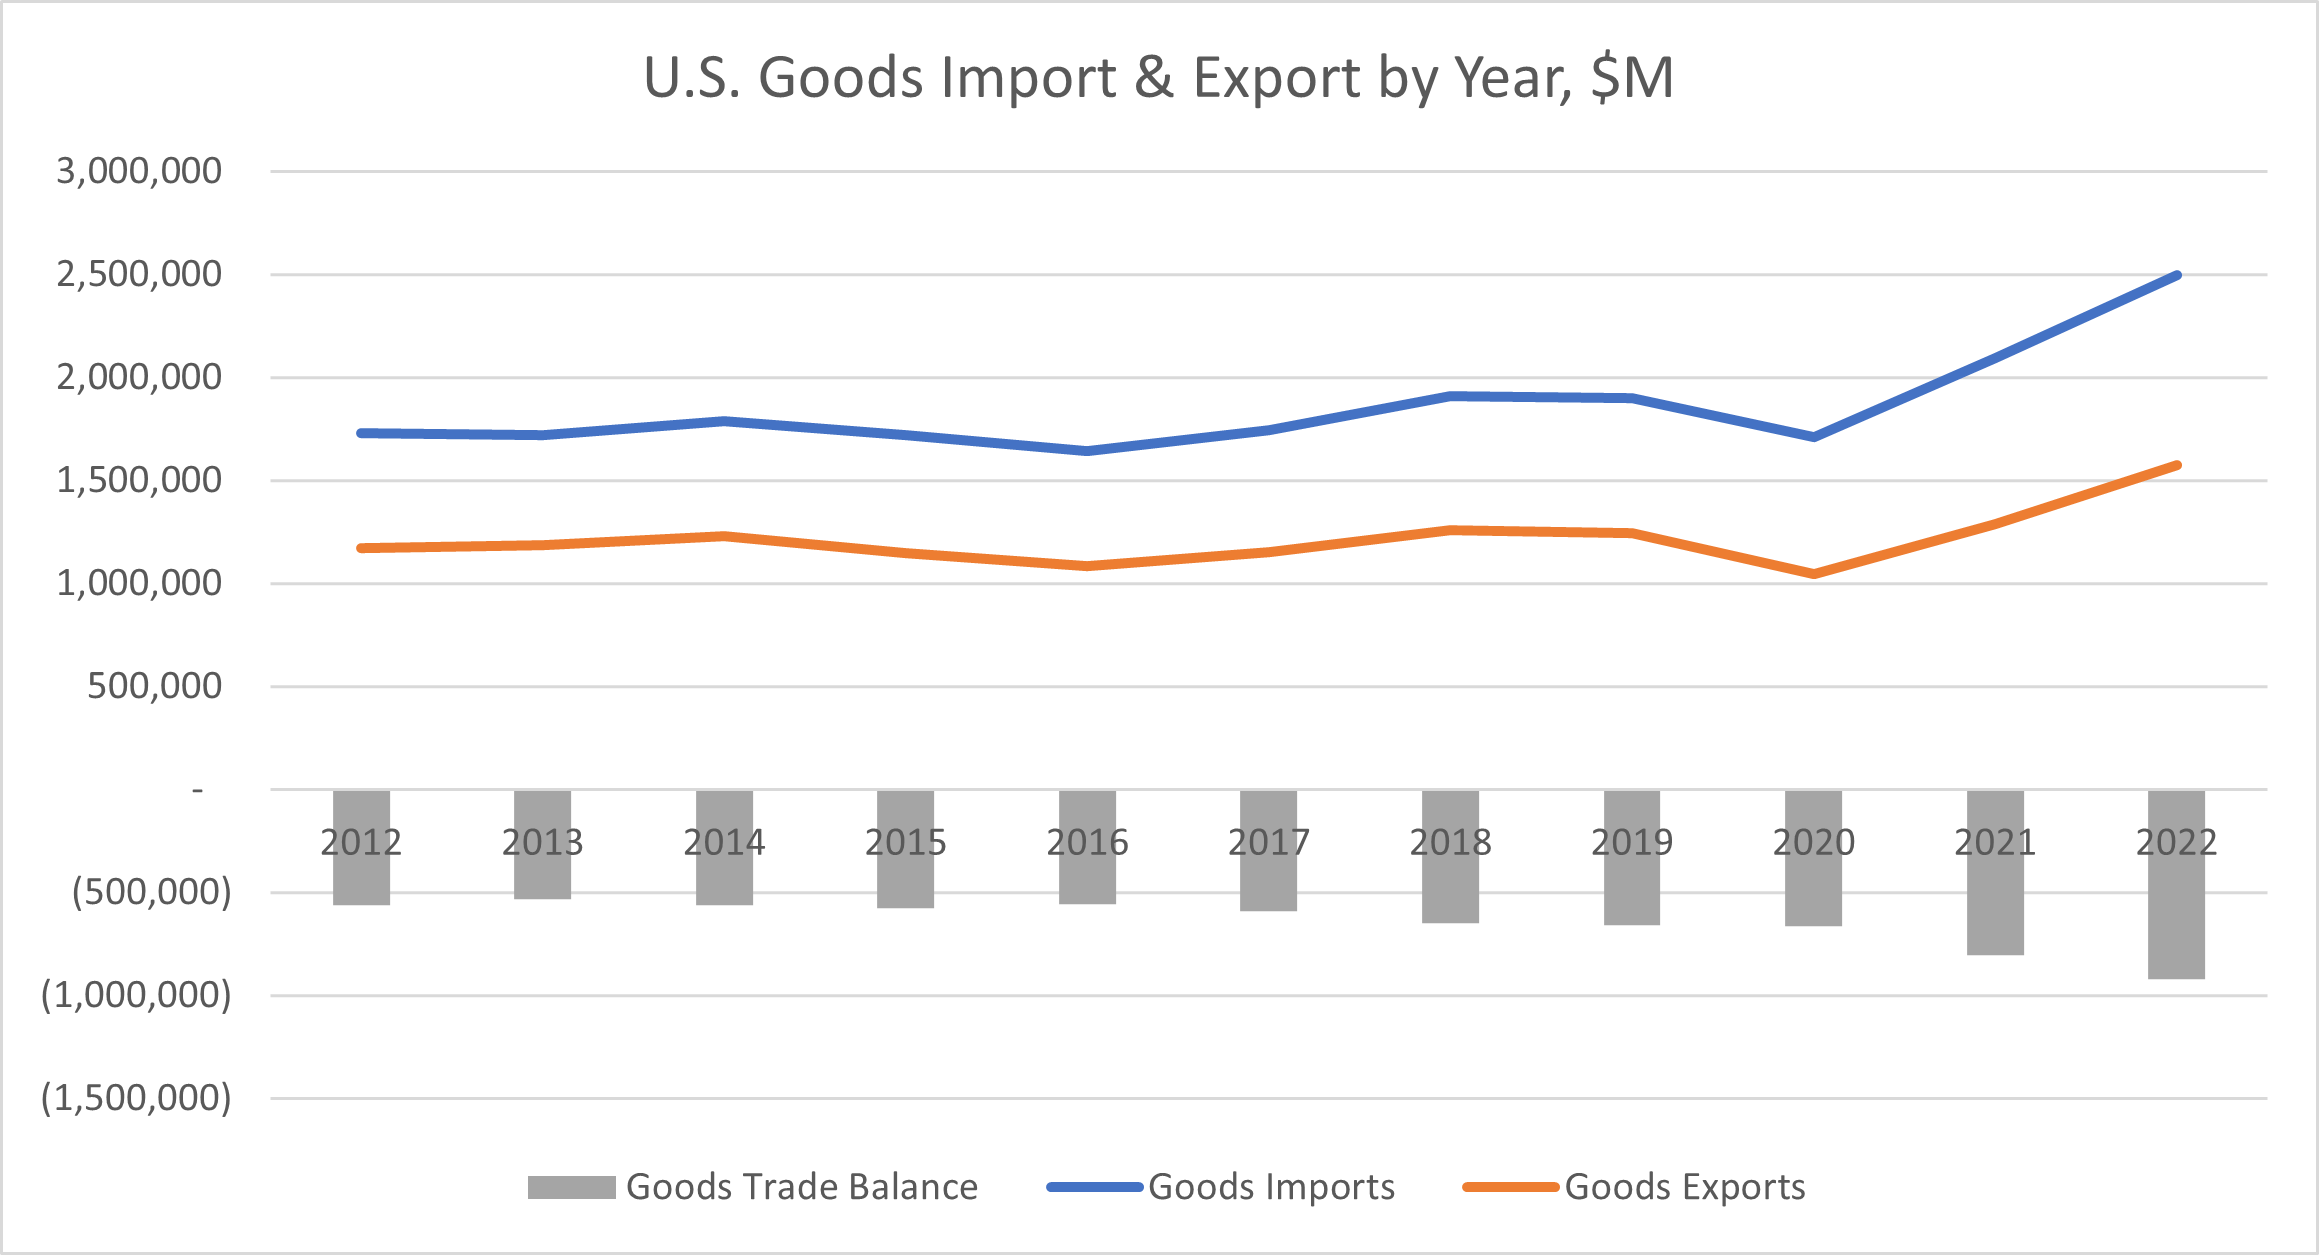
For the goods side, the U.S. has rebounded spectacularly from the trough of 2020. Goods imports increased 19.3% and exports increased 22.3% (YTD vs. 2021).
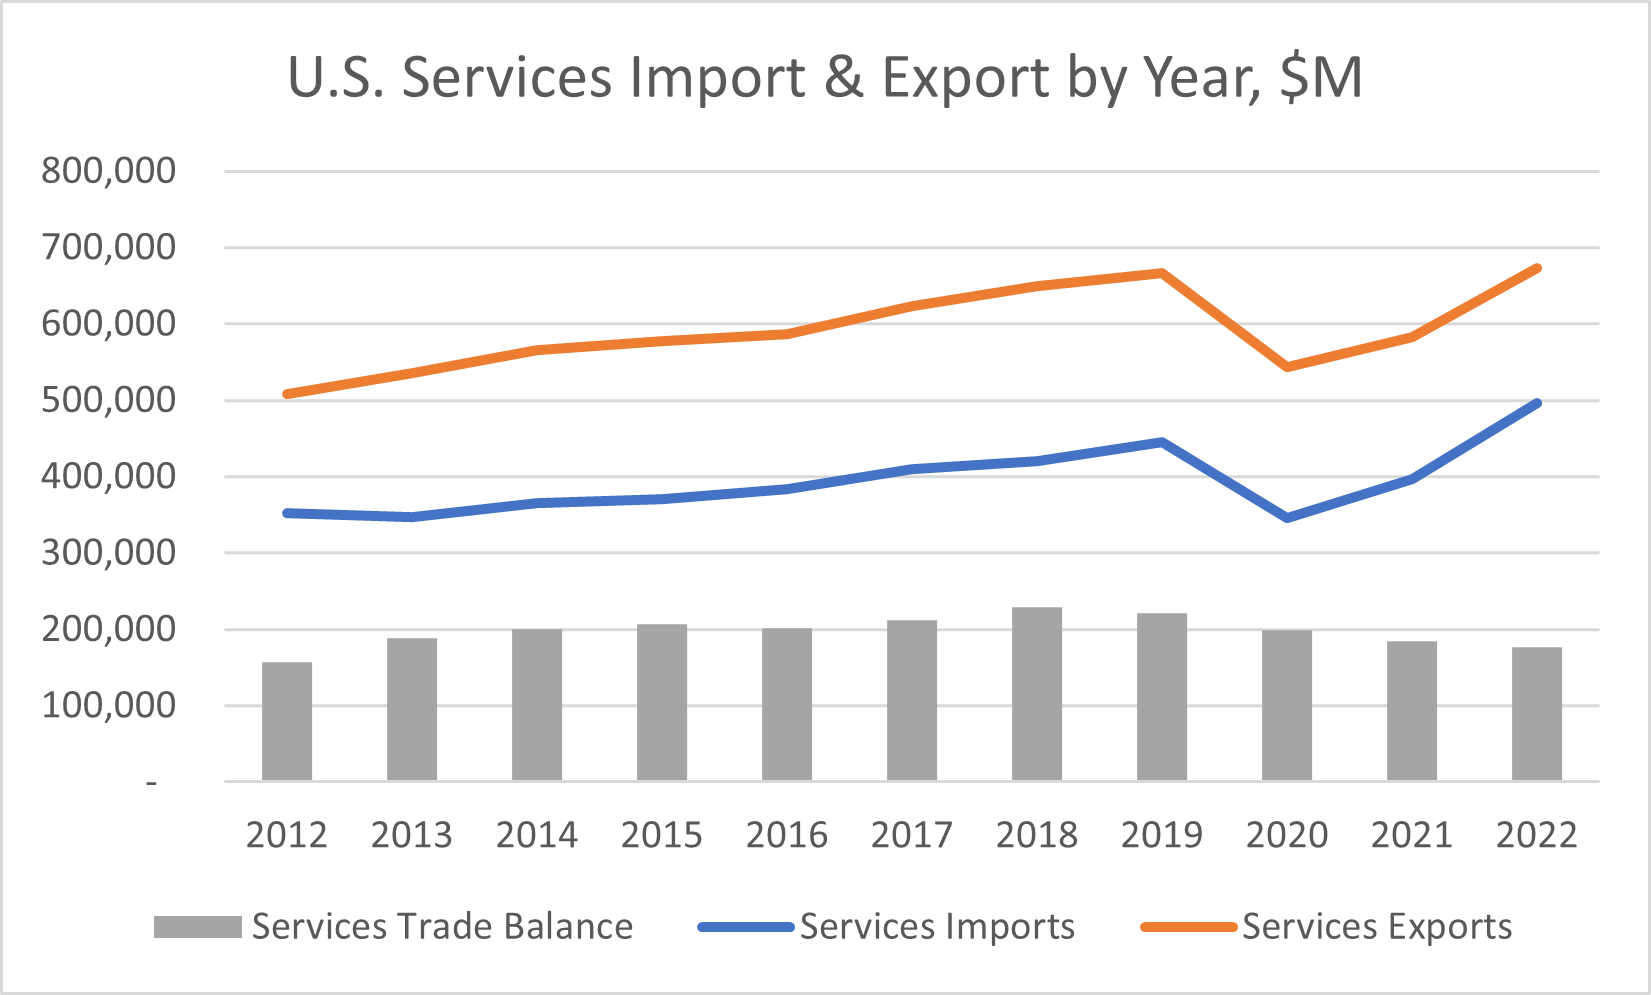
For the services side, a similar story is at play. Services imports increased 25.1% and exports increased 15.6% (YTD vs. 2021).
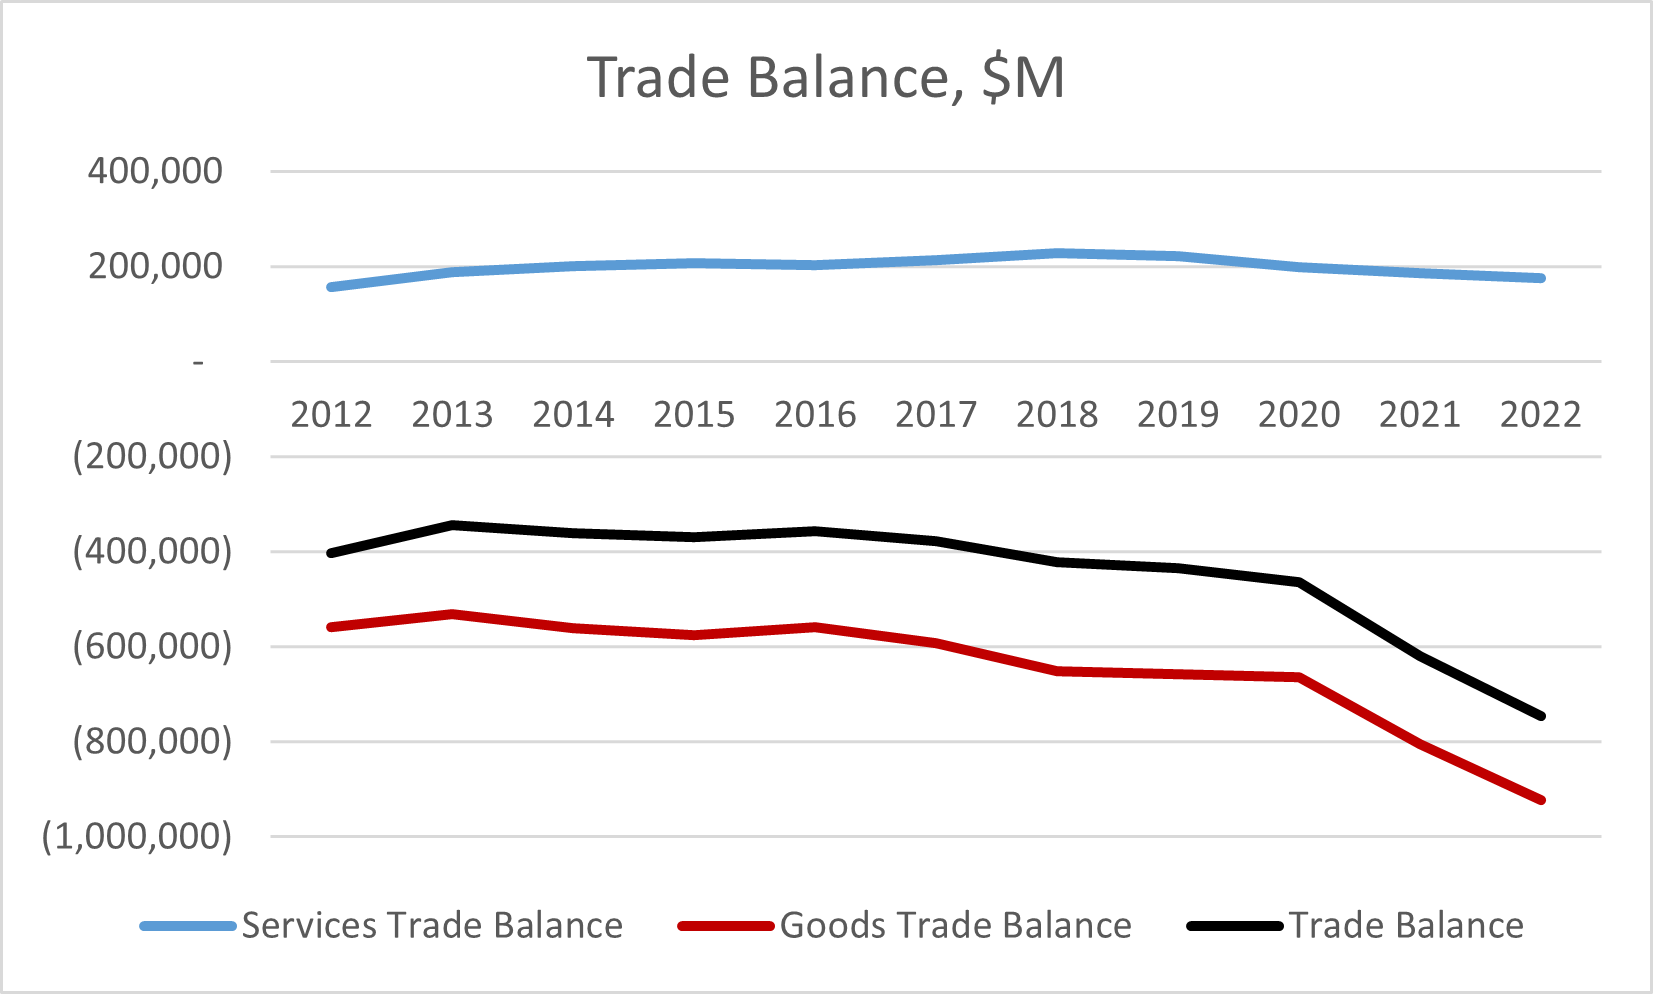
At a net trade balance perspective, the U.S. is at a trade deficit of $745.6B YTD. The goods trade balance hits a deficit of $922.2B and the services trade balance hits a surplus of $176.6B. This makes sense given that the U.S. is services-heavy nation and that consumers in the nation crave items such as foreign cars, electronics, shoes, etc. What is notable, however, is the all-time high of imports and exports.
Next, I wanted to understand the consumer sentiment:
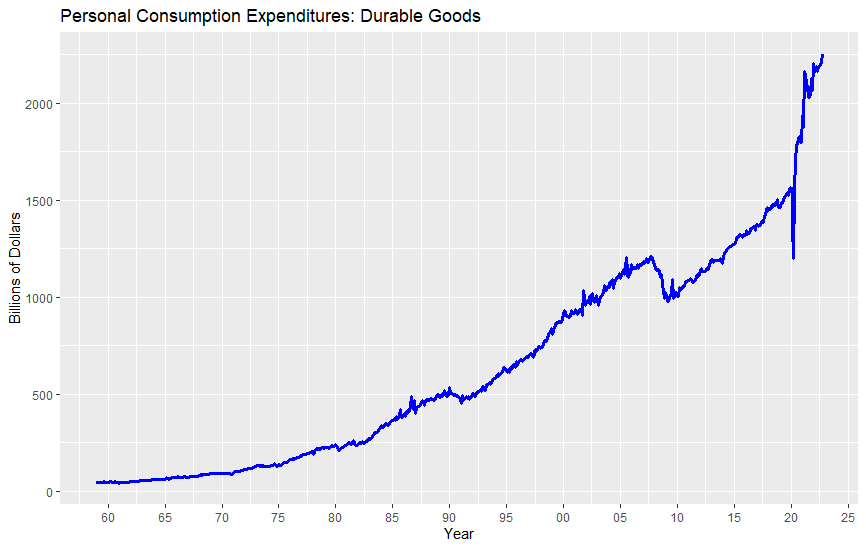
As of October, the personal spend on durable goods (e.g., cars, furniture, electronics, tools, etc.) is at a high of $2.2T. In theory, this demonstrates that the consumer has confidence in the economy. Just to stress test this, I pulled the data for the personal savings rate.
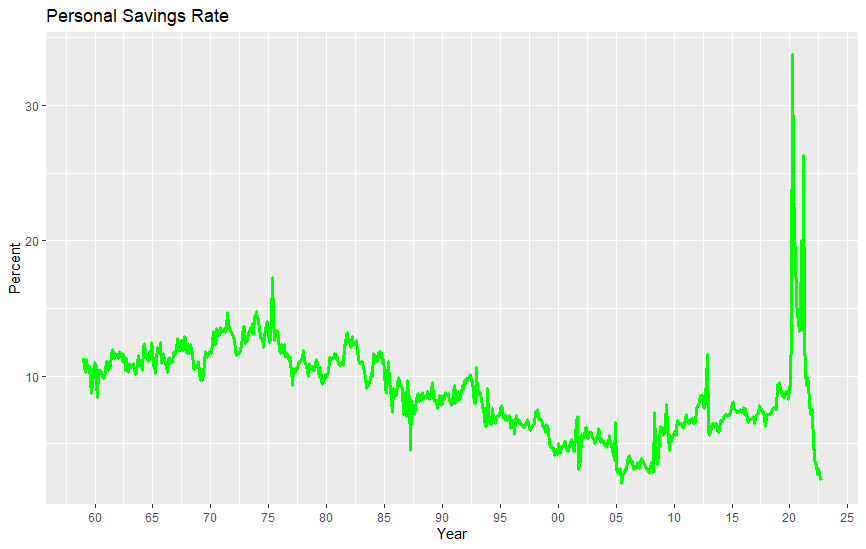
The personal savings rate is at 2.3%, which is quite low compared to the double-digit percentages of the onset of the pandemic. This suggests that as of October, consumers feel that there is economic certainty, rather than uncertainty as showcased in periods of negative shocks (e.g., recession). Again, this does not preclude a downturn as I anticipate that increases in savings rates are a reactive measure.
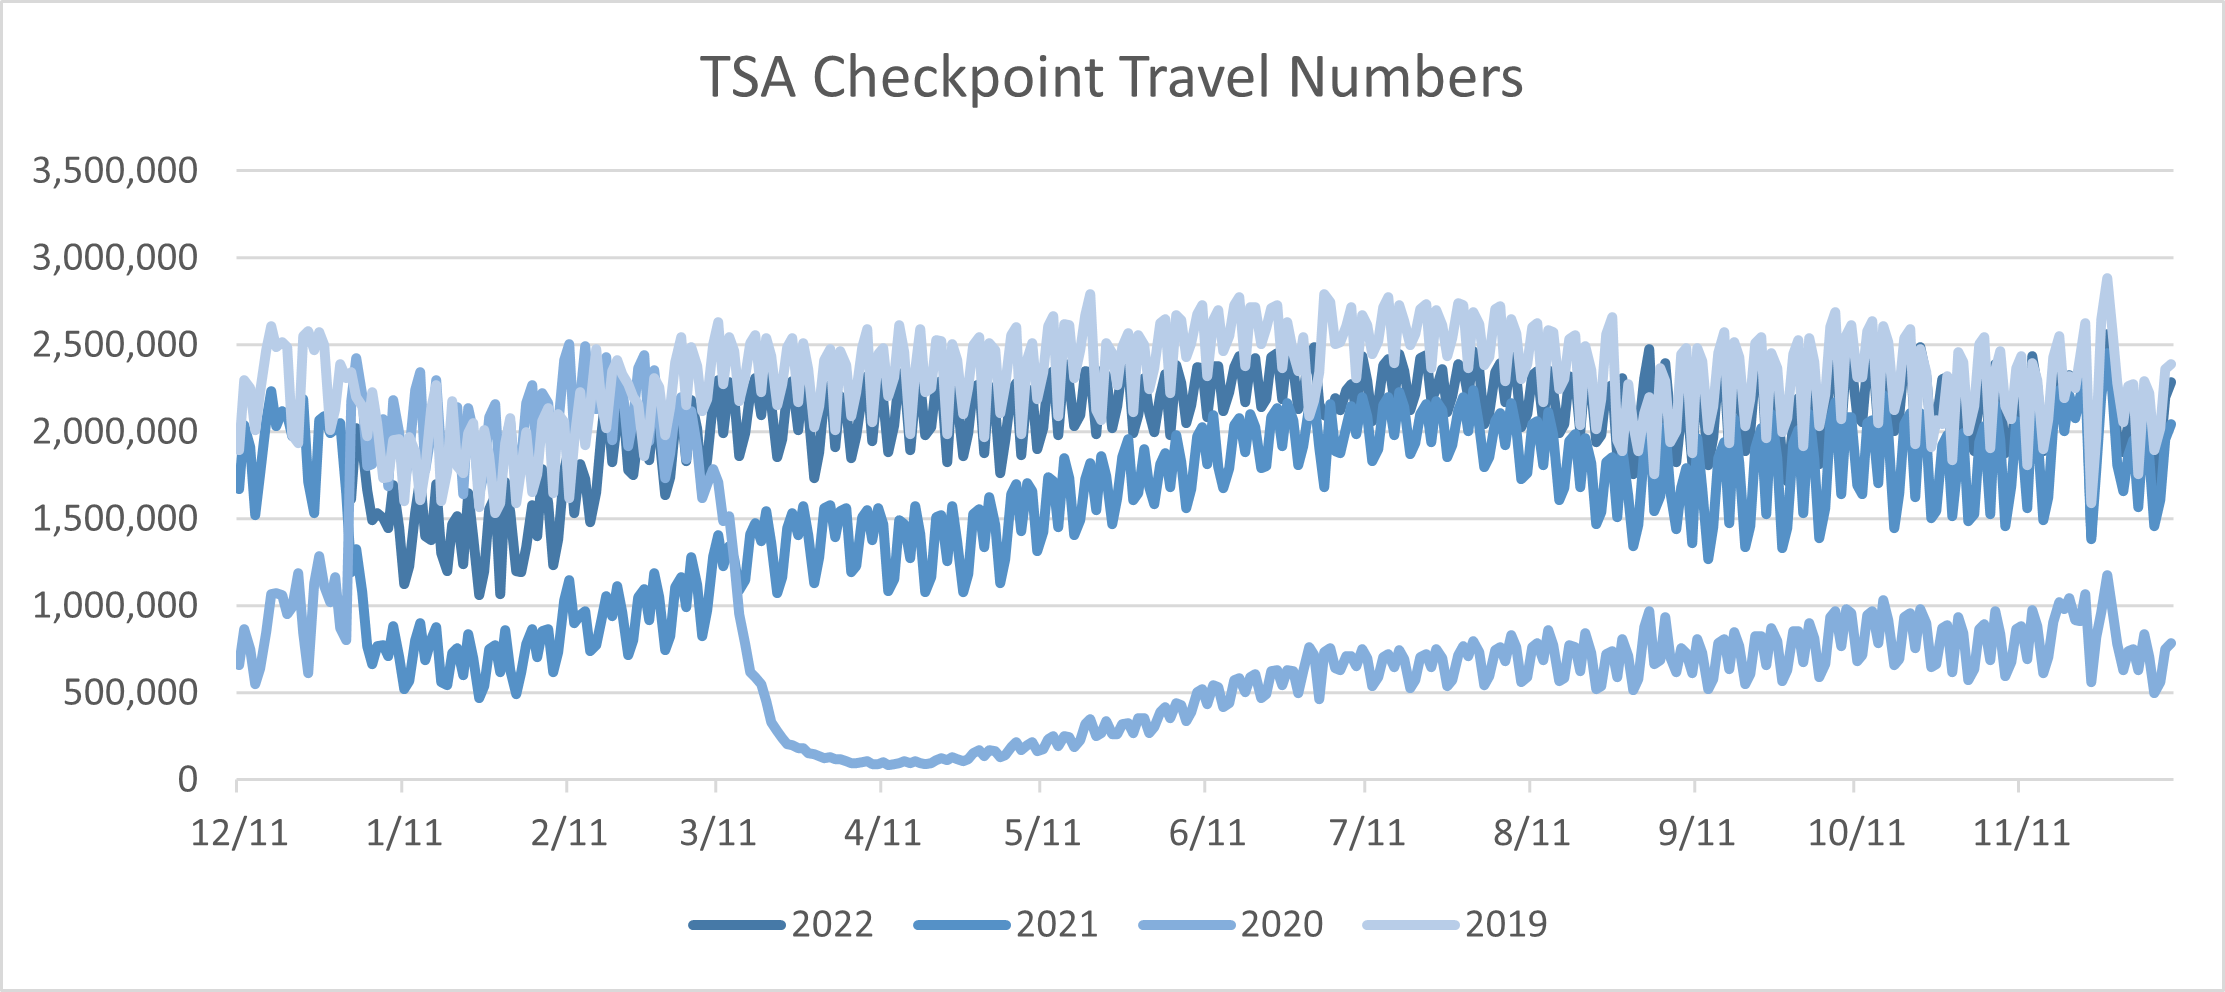
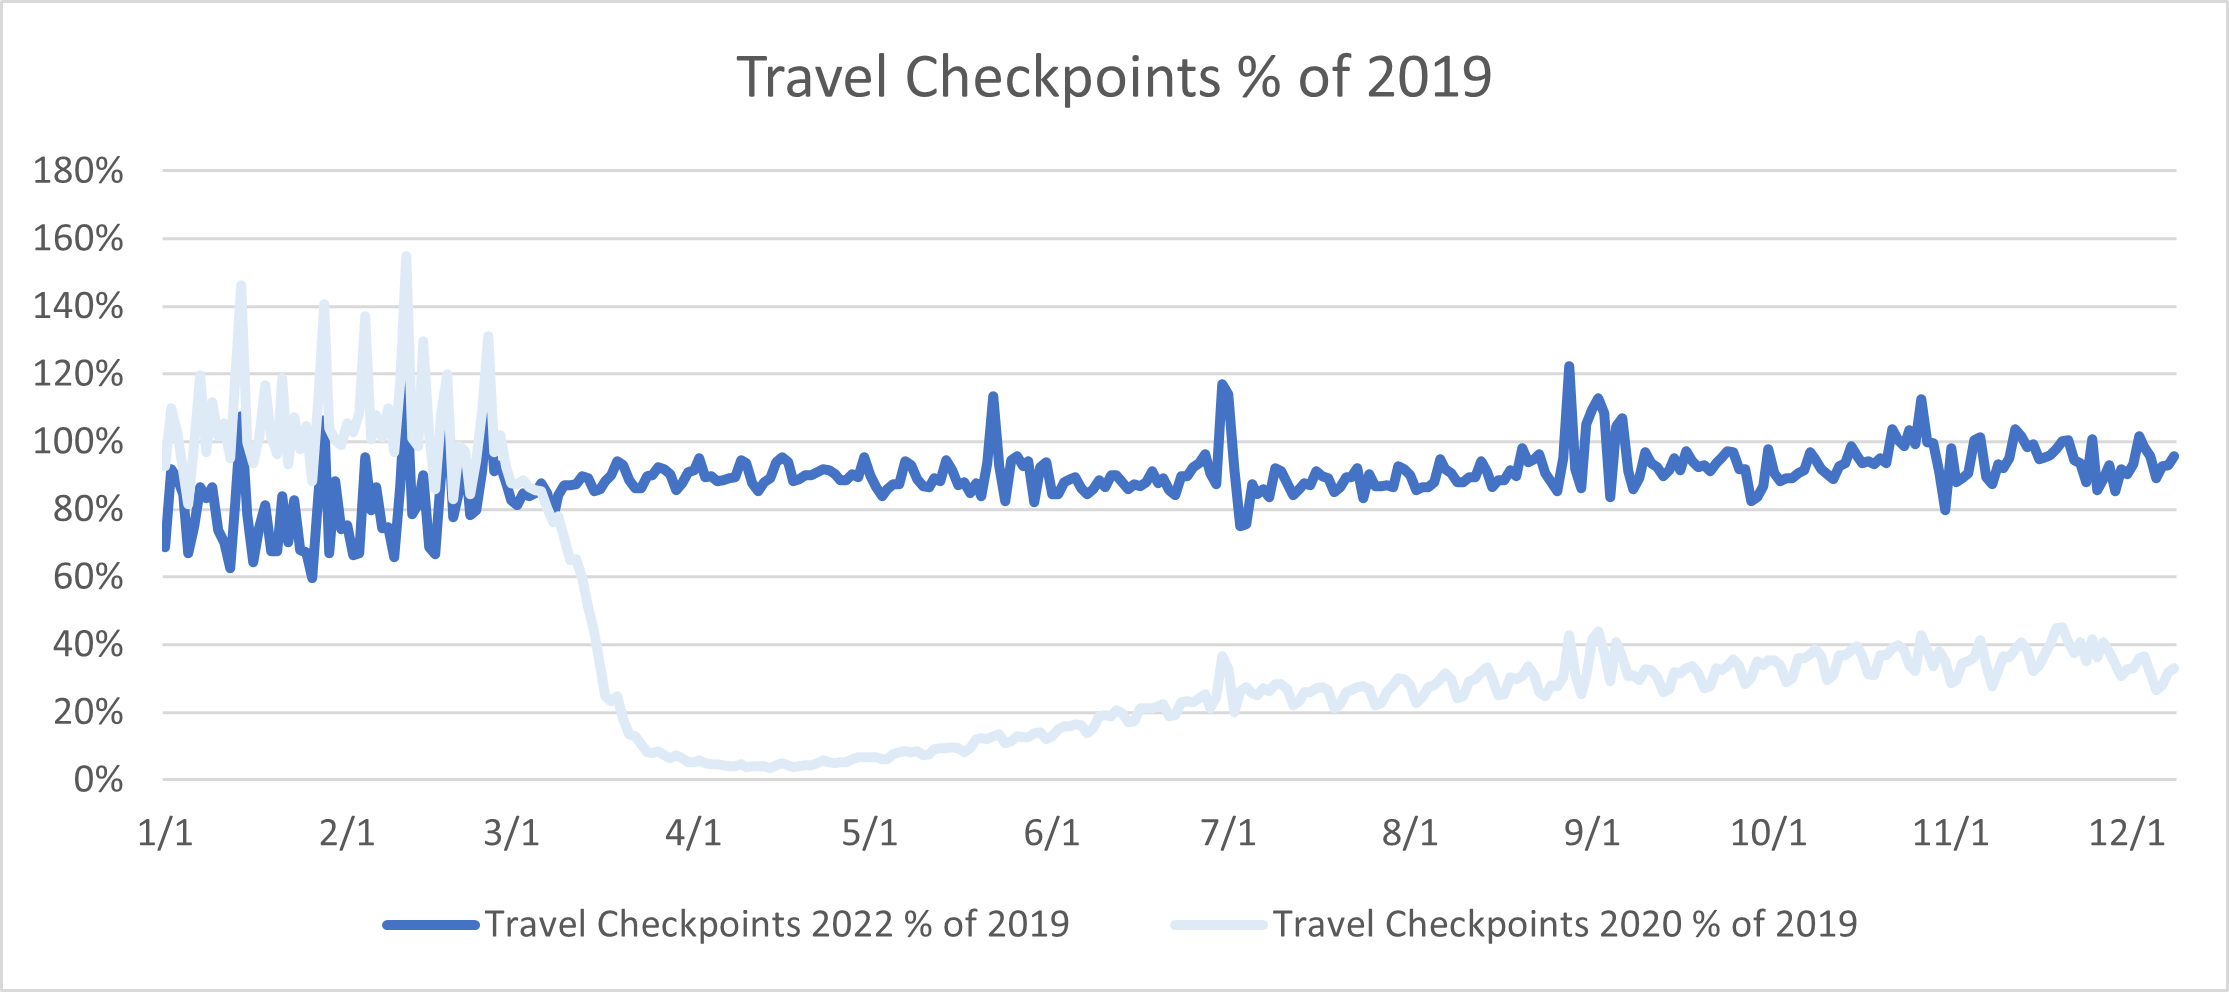
Travel is also returning to pre-pandemic levels. As of December 9th, the number of checkpoints is at 96% at the same day in 2019.
From the consumer perspective, we seem to be in a jolly mood.
Sources:
- https://www.trade.gov/data-visualization/ita-monthly-trade-infographic
- https://fred.stlouisfed.org/series/PCEDG
- https://fred.stlouisfed.org/series/PSAVERT
- https://www.tsa.gov/coronavirus/passenger-throughput